Defining the fleet management strategy
In order to make the best possible use of the purchased buses and plan for their renewal, a fleet management strategy must be defined. Depending on the networks, very different principles will come into play.
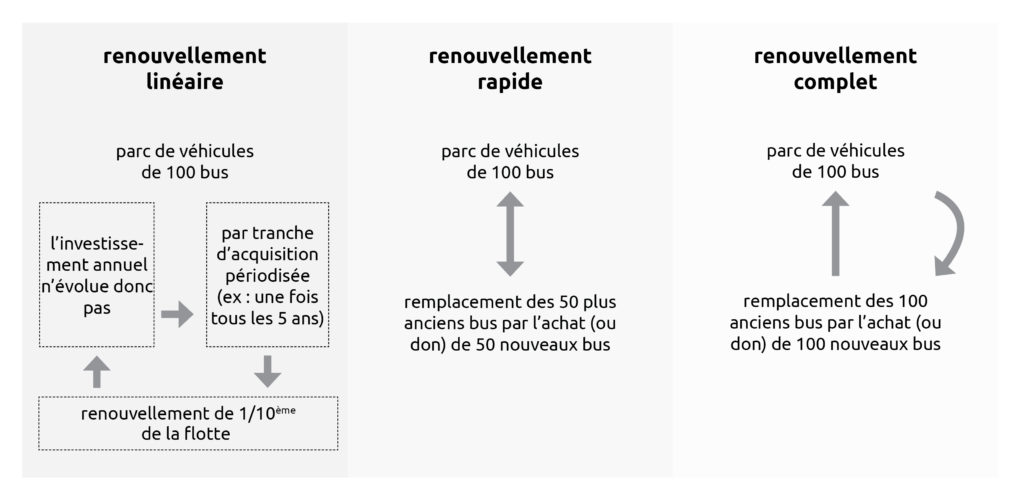
There are a number of different renewal strategies: Linear renewal (staggered replacement with acquisition tranches), rapid renewal or even the complete renewal of the fleet.
It is generally advisable to opt for a programme of renewal with acquisition tranches (linear renewal) to optimise the acquisition of buses.

Consequently, for a network of 100 buses, that will keep its vehicles for 10 years, this would amount to a turnover of 10 vehicles per year (10 purchases and 10 sales). Annual investment would therefore not change and would remain the same each year. In France, the average operating life of a bus is 15 to 17 years[1]. However, it is necessary to refine the analysis by type of vehicle and according to its use. For example, a minibus will have a shorter operating lifetime than a standard bus.
A regularly updated financial package must be applied to each of these tranches, so that they are more specific and transposable with the short-term investment needs.
While some French cases tend to opt for the strategy of standardising the bus fleet by working with a specific brand (which has benefits in terms of maintenance, driver training, etc.), in Africa, examples have demonstrated the benefit of being able to follow the development of ranges.
[1]https://www.transbus.org/dossiers/gestion-parc.html
What is the impact on the operating account?
>> The benefit of performing simulations:
Simulations on the impact of the investment on the operating account are often neglected, yet they are essential in being able to work out which investment in bus acquisitions would be the most optimal. A double-entry table is a useful tool that makes it easier to picture what the investment in new vehicles would cost but also what it could yield in the medium and long term. For example, investment in more modern – hence more fuel-efficient – vehicles can quickly prove to be more than profitable, especially in sub-Saharan cities, where a large proportion of the running costs of bus routes is attributable to the energy resources needed to run the vehicles. While a study by SYTRAL[1] showed that, in Lyon, 75% of the running costs are to pay for staff and only 15% are for energy, the trend is the other way round in sub-Saharan cities.
In addition to the cost of diesel over the lifetime of a bus, other factors must also be taken into account when calculating the lifetime cost of a bus, which substantially reflects the revenue/expenditure ratio. We can then distinguish between two types of balance:
– Small balance: operating revenues only finance operating expenses;
– Big balance: the operating revenue finances the operating cost and the repayment of the loans taken out to finance the investment.
Simulations carried out in advance can therefore be used to target the investment more effectively.